WHAT WE HAVE ON THIS PAGE
Introduction
Dell Statistics: Dell Inc. is an American Technology Company best known for its personal computers (PCs), Laptops, and beyond, which has carved a significant niche in the tech world. Dell products are known for durability and performance, making them a trusted choice for businesses and individual consumers alike. Dell has consistently ranked high in customer satisfaction surveys and received accolades for innovation and design. But how big is Dell exactly? Let’s dive into some interesting statistics to understand their reach and impact.
Editor’s Choice
- According to Dell Statistics, as of 2024, Dell Technologies is expected to gain around $88.43 billion in revenue.
- By the end of 2023, Dell’s total revenue was $102.3 billion, an increase of 1% from 2022.
- Dell anticipates that its worldwide revenue will be segmented into Infrastructure Solutions Group ($33.89 billion) and Client Solutions Group ($48.92 billion) by 2024.
- Moreover, estimated revenue by sub-segments will be servers and networking ($17.62 billion), storage ($16.26 billion), commercial ($39.81 billion), and consumer ($9.1 billion).
- As of 2024, Dell Technologies’ total employee count is supposed to be 120,000.
- On the other hand, Dell’s net income will be $3.2 billion in the financial year 2024.
- The company has spent more than $2.8 billion on research and development worldwide in 2023.
- Dell Statistics further stated that by 2024, the total assets captured by Dell are expected to be $82.09 billion.
- In 2023, Dell Technologies used 884 million Kilowatt-hours of electricity, and almost 59% of Dell’s electricity was green.
- The company has spent nearly $2.8 billion on research and development worldwide by 2023 end.
Dell Technologies’ revenue analyses from 1996 to 2024
(Reference: statista.com)
Beyond PCs: A Diverse Product Portfolio
Dell isn’t just about PCs. They offer a comprehensive range of technology solutions, including:
- Laptops – From budget-friendly Chromebooks to high-performance gaming laptops, Dell caters to various needs.
- Servers – The backbone of many businesses, Dell servers provide reliable data storage and processing power.
- Monitors – Offering a variety of sizes, resolutions, and features, Dell monitors enhance the user experience.
- Software – Dell provides software solutions that complement their hardware, offering a one-stop shop for businesses.
- Services – Dell offers various services, from technical support to data center management, assisting customers throughout the product lifecycle.
General Dell Statistics
- Dell’s story began in 1984, making them a tech veteran with over 35 years of experience.
- It all started with a bold move: selling upgraded IBM computers. Today, Dell offers a vast array of products, from laptops and desktops to servers and software.
- Currently, the company operates across 180 countries and has around 120K employees.
- While specific sales figures aren’t publicly available, considering their long history and brand recognition, it’s safe to say Dell has shipped millions of devices worldwide.
- Dell Statistics further states that, in 2023, the company has spent approximately $2.8 billion on research and development worldwide. From 2000 to 2023, overall R&D spending increased to $374 million.
- As of March 2024, dell.com had received 41.7 million total website visits, an increase of 8.36% from last month. The bounce rate was 48.89%.
- However, the mobile and desktop traffic share of dell.com was 57.84% and 42.16%, respectively.
Financial Analyses of Dell Technologies
- According to Dell Statistics, by the end of the year, Dell Technologies’ total revenue was $102.3 billion, up 1% from last year.
- Moreover, the operating income of the company resulted in $5.8 billion, an increase of 24% YoY.
- Non-GAAP operating income: $8.6 billion (+11%)
- Net income from continuing operations: $2.4 billion and non-GAAP net income: $5.7 billion.
- Operational cash flow: $3.6 billion
- Diluted earnings per share from continuing operations: $3.24 and non-GAAP diluted earnings per share: $7.61.
Financial Analyses in the 4th Quarter of 2023
- Dell Statistics further states that Dell’s revenue turned out to be $25 billion, which has decreased by 11% from last quarter.
- The operating income of the company resulted in $2.2 billion, an increase of 8.7% of YoY’s revenue.
- Net income from continuing operations: $606 million, and non-GAAP net income: $1.3 billion.
- Operational cash flow: $2.7 billion
- Diluted earnings per share from continuing operations: $0.84 and non-GAAP diluted earnings per share: $1.80.
Beyond Numbers: The Dell Effect
Statistics paint a picture, but Dell’s impact goes beyond mere numbers. Here’s how they’ve shaped the tech landscape:
- Democratizing Technology: Dell’s focus on affordable yet reliable PCs has made technology more accessible to individuals and businesses, contributing to the tech industry’s overall growth.
- Driving Innovation: Dell is constantly pushing boundaries, from developing powerful workstations to exploring artificial intelligence solutions. This commitment to innovation benefits the entire tech ecosystem.
- A Global Force for Progress: Dell’s global presence promotes digital inclusion and empowers businesses worldwide to leverage technology for growth.
Dell Statistics by Segmental Revenue (Analyses From 2015 to 2024)
 (Reference: statista.com)
- The above Statista report on Dell Statistics claimed that Dell Technologies’ is segmented into two sections: Infrastructure Solutions Group and Client Solution Group, resulting in $38.36 billion and $58.21 billion revenue, respectively, in 2023.
- Similarly, it is predicted that by 2024, the two largest segments of Dell’s worldwide revenue will be the Infrastructure Solutions Group ($33.89 billion) and Client Solutions Group ($48.92 billion).
Dell Statistics By Sub-Segmental Revenue

(Reference: statista.com)
- In 2023, global revenue generated by Dell Technologies’ sub-segment was servers and networking ($20.4 billion), storage ($17.96 billion), commercial ($45.56 billion), and consumer ($12.66 billion).
- By the end of 2024, estimated revenue by sub-segments will be servers and networking ($17.62 billion), storage ($16.26 billion), commercial ($39.81 billion), and consumer ($9.1 billion).
Dell Statistics By Total Assets Statistics

(Reference: statista.com)
- As mentioned in Dell Statistics, in 2023, Dell Technologies’ total assets amounted to $89.61 billion, gradually decreasing from the previous two years.
- However, according to Statista report analyses, total assets are expected to be $82.09 billion by the end of 2024.
Dell Statistics By Number of Employees (from 1996 to 2024)

(Reference: statista.com)
- As per the records of Dell Statistics 2024, the total employee count of Dell Technologies is supposed to be 120,000, which has reduced by 13K from last year.
- In 2023, the company had around 133,000 employees, the same as in 2022.
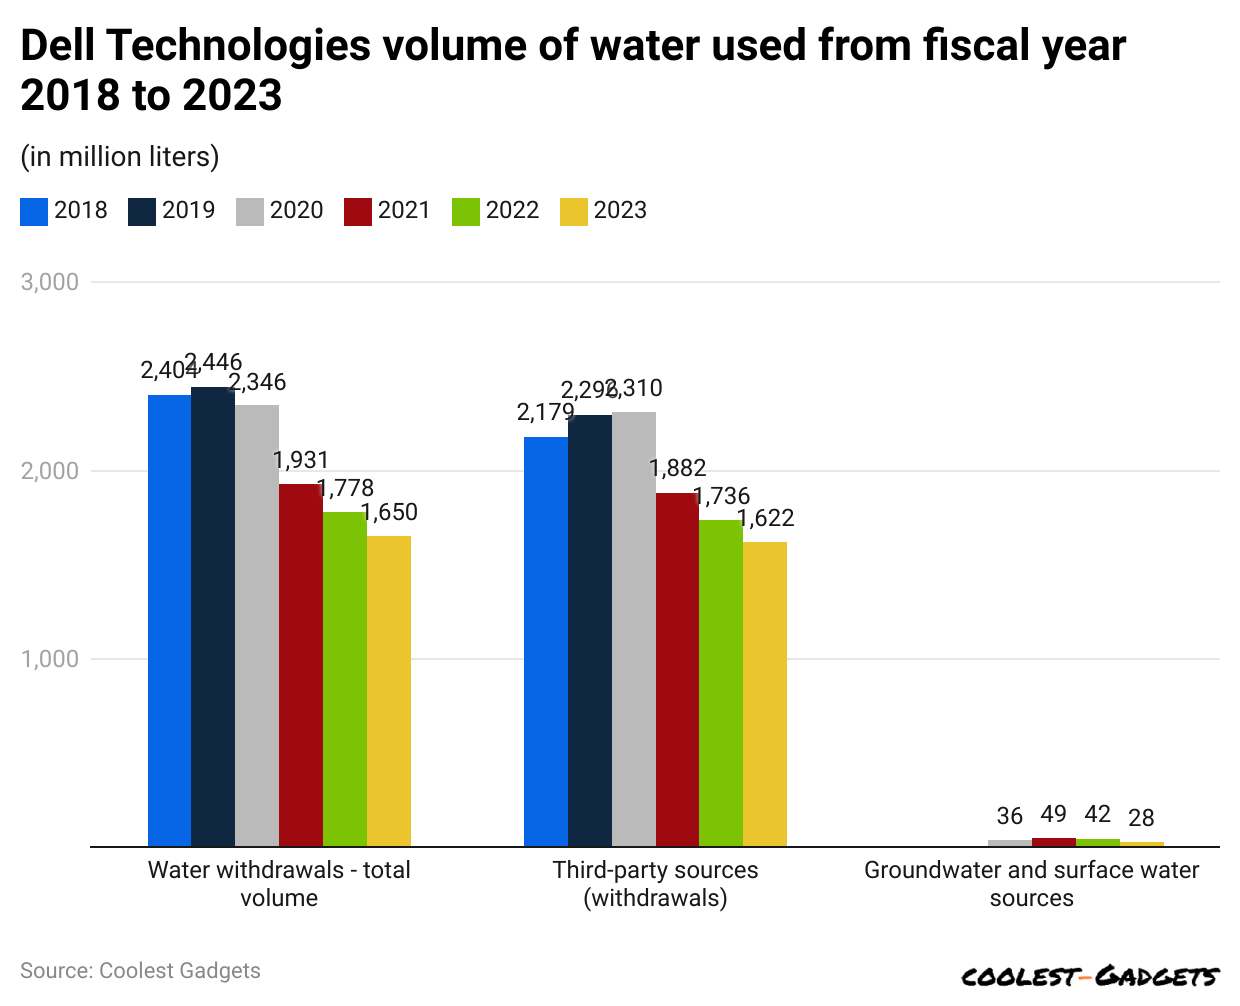
Dell Statistics By Volume of Water Used (from 2018 to 2023)
(Reference: statista.com)
- In the financial year 2023, the total water consumed by Dell Technologies was 1.65 billion liters, which came from various water withdrawals.
- In the same year, around 1.62 billion liters of water were consumed from third-party sources.
- Meanwhile, only 28 million liters of water were consumed from groundwater and surface water sources.
Dell Statistics By Shipment
- In the United States, Dell shipped almost 3.83 million and 4.85 million PC units in the 1st and 2nd quarters of 2023, respectively.
- In the nation, PC unit shipment share in the Q2 of 2023 was 26.7%.
- On the other hand, Dell’s global shipment of personal computers amounted to 64.28 million units, according to a report generated by Statista.
- Moreover, in the 3rd quarter of 2023, global shipment turned out to be 10.32 million units.
- However, Dell’s PCs’ worldwide shipment share in Q1 and Q2 of 2023 was 17.3% and 17.4%, respectively.
By Sustainable Material Usage in Products and Packaging
(Reference: statista.com)
- According to Dell Statistics, the Dell Company used more than 39.08 million Kilograms of sustainable material in 2023.
- Recycled plastics and reclaimed carbon fiber accounted for around 21.19 million kilometers and 4.65 million Kilometers of sustainable material, respectively.
- Meanwhile, other sustainable material usages by Dell Technologies in 2023 were ocean-bound plastics (1.50 million Kilograms), bio-plastics (2.06 million Kilograms), and recycled steel (12.8 million Kilograms).
By Generated Waste from Manufacturing Operations
(Reference: statista.com)
- As of 2023, Dell generated around 16,971 metric tons of nonhazardous waste.
- Meanwhile, the majority of waste materials, up to 15,340 metric tons, were either recycled or reused.
- Almost 1,347 metric tons of nonhazardous waste were recovered to energy.
- Sixty-one metric tons of waste was composted, and 223 metric tons of waste were landfilled.
Dell’s Energy Used in Operations Statistics by Types
(Reference: statista.com)
- In 2023, the total electricity consumed by Dell Technologies was 884 million Kilowatt-hours, which has reduced gradually since 2018.
- The types of energy consumed in operations are renewable electricity (552 KWh), other energy (154 KWh), and total energy (1,038 KWh).
Dell’s Greenhouse Gas Emissions Statistics by Scope
- According to Dell Statistics, in the fiscal year 2023, greenhouse gas (GHG) emissions by both Dell Technologies’ Scopes 1 and 2 amounted to 199,100 metric tons of carbon dioxide equivalent.
- Furthermore other GHG emission characteristics by scopes (in metric tons of carbon dioxide equivalent) are Scope 1 = 45,800, Scope 2 – market-based = 153,300, Scope 2 – location-based = 330,600, Scope 3 – business air and rail travel = 54,800, Scope 3 – use of sold products = 14,410,000, Scope 3 – upstream – fuel and energy-related activities = 129,500, and Scope 3 – upstream – transportation/distribution = 1,123,500.
Dell Laptop Statistics by Regions
- In Q1 of 2023, the Dell laptop market accounted for by the United States was 26.4% of the share.
- The Western Europe market share of Dell laptops was 14.2%.
- Meanwhile, India and China hold a market share of 33.2% and 11.6%
Dell Laptop Statistics by an Indian User

(Reference: statista.com)
- According to Dell Statistics, by December 2023, the maximum number of Dell Laptop users in India were aged between 25 and 34, holding a share of 27%.
- 7% and 23.2% of the user share belong to people aged 34 to 44 and 44 and above, respectively.
- Moreover, 18 to 24-year-old Dell laptop users accounted for 20.9% of the share, and those over 18 made up 16.8% of the share.
Website Traffic Unveils Their Audience:
We can analyze Dell’s website traffic (https://www.dell.com/) to get a sense of their audience reach. According to Similarweb and Semrush, both are website traffic analysis tools, Dell attracts a significant audience:
Website Traffic Statistics by Country

(Source: similarweb.com)
- Dell Statistics declared that the United States of America had captured the highest website traffic on dell.com, resulting in a 29.09% share, which increased by 2.16% in total website visitors in March 2024.
- Besides, other countries total website traffic shares are Japan = 9.62% (+11.74%), Brazil = 7.21% (+21.12%) and India = 6.61% (-4.29%), and United Kingdom = 4.02% (+12.65%)
- In addition, other countries collectively made a visitor share of 43.45% on dell.com.
By Device

(Reference: semrush.com)
- Dell Statistics reveals that the mobile and desktop traffic share of dell.com in March 2024 was 57.84% and 42.16%, respectively,
- The total user share in Dell was 34.57% in the United States, resulting in 29.22 million, of which desktop and mobile users accounted for 46.49% and 53.51%, respectively.
- Brazil has recorded 15.27 million website users, with a traffic share of 18.07%. Meanwhile, desktop and mobile users accounted for 22.72% and 77.28% of the share, respectively.
- Followed by Japan (5.7 million and 6.74%), India (4.45 million and 5.27%), and the United Kingdom (2.91 million and 3.44%), respectively.
- The desktop and mobile user shares are Japan (43.28% and 56.72%), India (49.15% and 50.85%), and the United Kingdom (40.28% and 59.72%), respectively.
By Demographics

(Reference: similarweb.com)
- Dell statistics based on age group, the highest number of website users observed is between 25 and 34 years, made 30.66% share, on March 2024.
- On the other hand, 22.33% of the website users were between 35 and 44 years old.
- The other users’ shares, followed by 16.57% and 15.86%, belong to 18 to 24 years and 45 to 54 years, respectively.
- Around 9.04% of Dell website users are between 55 to 64 years or older.
- Sixty-five years old and above contribute a smaller share of 5.55%.
- On the other hand, in March 2024, male and female users on dell.com were 66.87% and 33.13%, respectively.
By Traffic Sources

(Reference: similarweb.com)
- From the point of view of Dell Statistics, the highest traffic rate towards dell.com was accounted for by organic search with a 46.33% share.
- Direct search is the next most popular traffic source, with 32.45%, while paid search generates a share of around 8.66%.
- In addition, other traffic source shares included referrals (4.26%), social (1.69%), mail (1.66%), and display (4.94%).
By Social Media Referral Rate

(Reference: similarweb.com)
- YouTube accounted for the highest social media traffic rate, with a share of 38.44% on dell.com.
- Reddit and Facebook contribute 27.9% and 9.03% of social traffic share, respectively.
- LinkedIn (7.93%) and WhatsApp (5.93%) are the top social media traffic sharers.
- Other social media traffic rates collectively made a 10.77% share.
The Future of Technology with Dell
- Personalized Tech Experiences: Imagine PCs and laptops that learn your preferences and adjust settings accordingly. Dell could be a leader in developing AI-powered features that personalize the user experience.
- The Rise of AR/VR: Augmented reality (AR) and virtual reality (VR) technologies are gaining traction. Dell could develop innovative hardware and software solutions that leverage AR/VR for various applications, from education and training to entertainment and design.
- Focus on the Future of Work: The way companies work is constantly evolving. Dell could offer solutions for a hybrid work environment with seamless transitions between office and remote work setups.
Best Dell Laptops of 2024
- Dell XPS 13 OLED (Best overall): $1,699
- Dell XPS 13 Plus (Best-looking): $1,399
- Alienware M16 (Best gaming): $1,199.99
- Dell XPS 15 (Best 15-inch): $1,870
- Alienware M18 (Best 18-inch): $1,849
- Dell Latitude 7320 (Best for business): $499.99
- Dell XPS 17 (Best 17-inch): $1,799
- Dell Inspiron 16 Plus (Best 16-inch): $1,300
Conclusion
Dell Technologies is a tech giant with a rich history of 35 years and an enormous global presence. The company is mainly focused on innovation and customer satisfaction, and Dell is well-positioned to continue shaping the future of technology for years to come.
If you are considering investing in Dell, this paper on Dell Statistics will be beneficial as it includes several informative analyses from different insights based on current trends.
Related Reads

WHAT WE HAVE ON THIS PAGE1 Introduction2 Editor’s Choice3 […]

WHAT WE HAVE ON THIS PAGE1 Introduction2 Editor’s Choice3 […]

WHAT WE HAVE ON THIS PAGE1 Introduction2 Editor’s Choice3 […]
Trending Products